 Swapnil Gourshete
 When application gets stable at some point, we try to improve things we built for a while now. And improving performance tops the list for me. Application performance is a large concept which can be measured with different number of parameters. It also depends on underlying infrastructure.
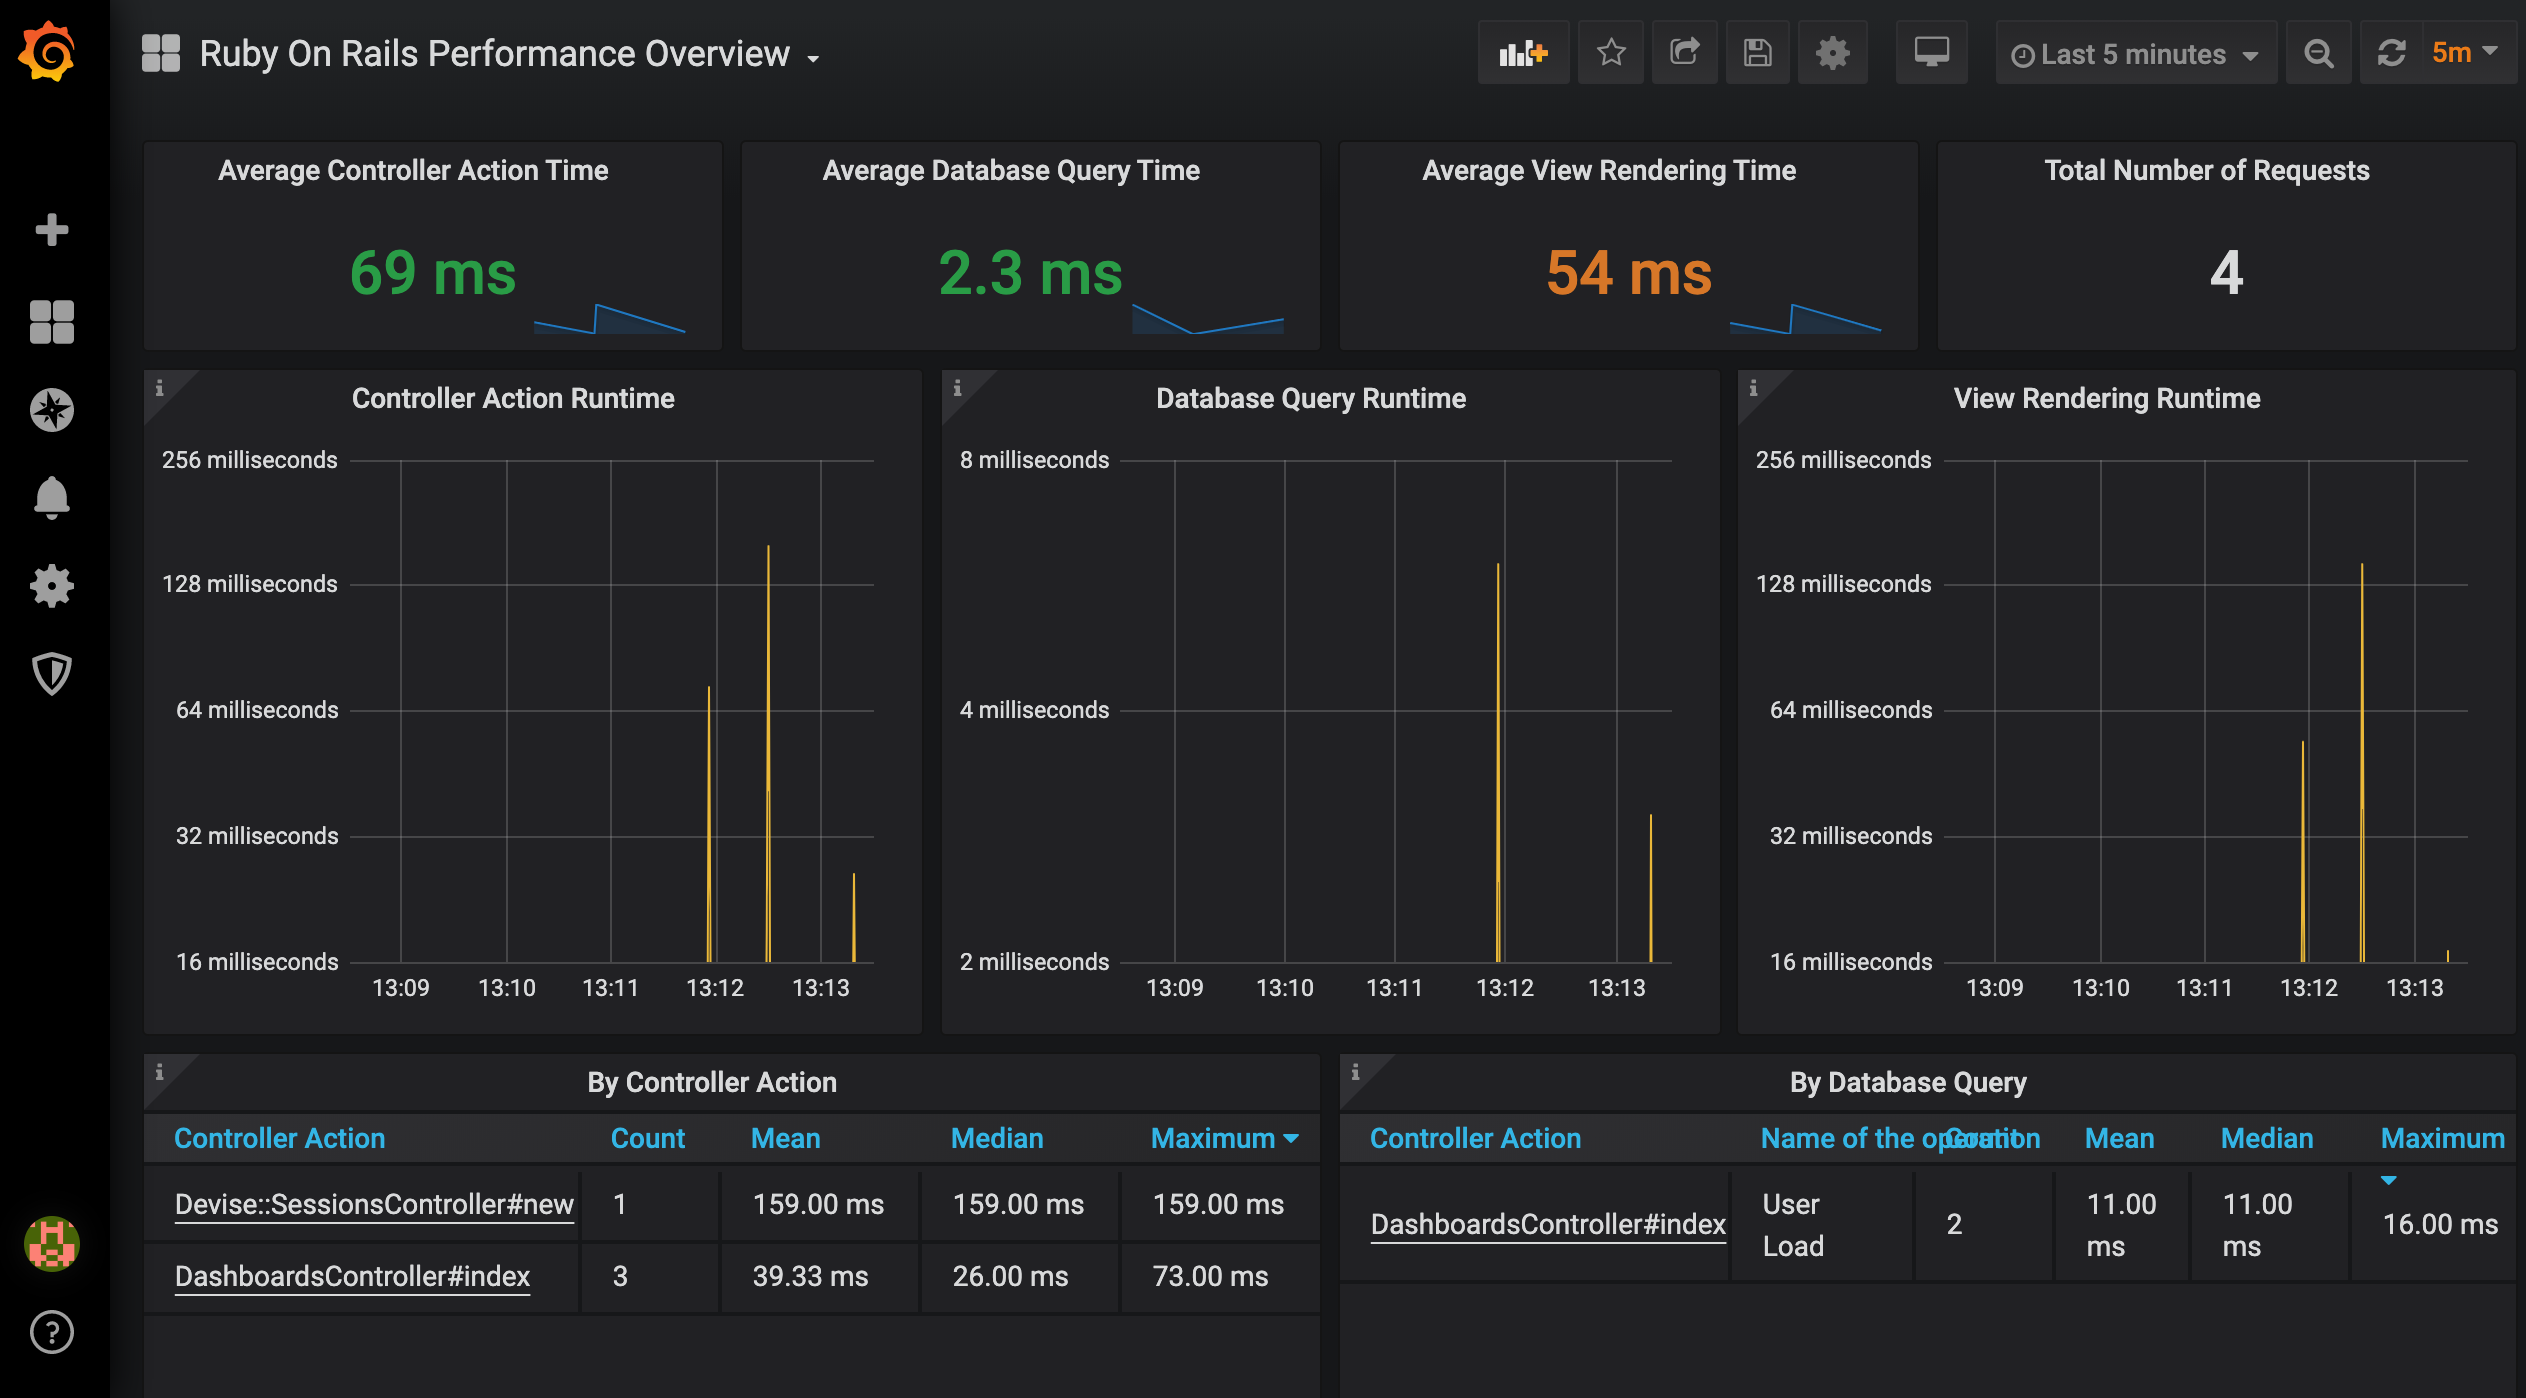
So here we will setup very simple and minimalistic performance dashboard for a Rails application which will help us monitor controller action runtime, database query runtime and view rendering runtime. Let’s start
Pre-requisites
- influxdb: install unless is_influxdb_installed?
- grafana: install unless is_grafana_installed?
- Rails app
- Now add gem
influxdb-railsgem to Rails application Gemfile and runbundle. To get things up runbundle exec rails generate influxdbThis will create initialzer config/initializers/influxdb_rails.rb, which allows configuration of this gem.
-
We need one infuxdb database to store performance time series data, which eventually will be used by grafana dashboard. Open influxdb cosnole by running
influx. If you face issue of connection refused, make sureinfluxdis running. Once console is accessible create a database. I’m creating database named ‘rails-dev’ for now. - We need to tell our rails application what database it should look for to store data. If it is going to use database service from another instance, we must provide hostname. For all this, open influxdb initializer file.
For database name -
config.client.database = "rails-dev"
If you are going to use a hosted influxdb instance then provide its address here
For hostname -
config.client.hosts = ["host-name.com/8086"]
At this point we are set with storing performance metrics data into influxdb ‘rails-dev’.
-
Check if grafana installed is working. Open http://localhost:3005. Recheck if port number is appropriate. You can verify port number and other details of grafana from ‘grafana.ini’
-
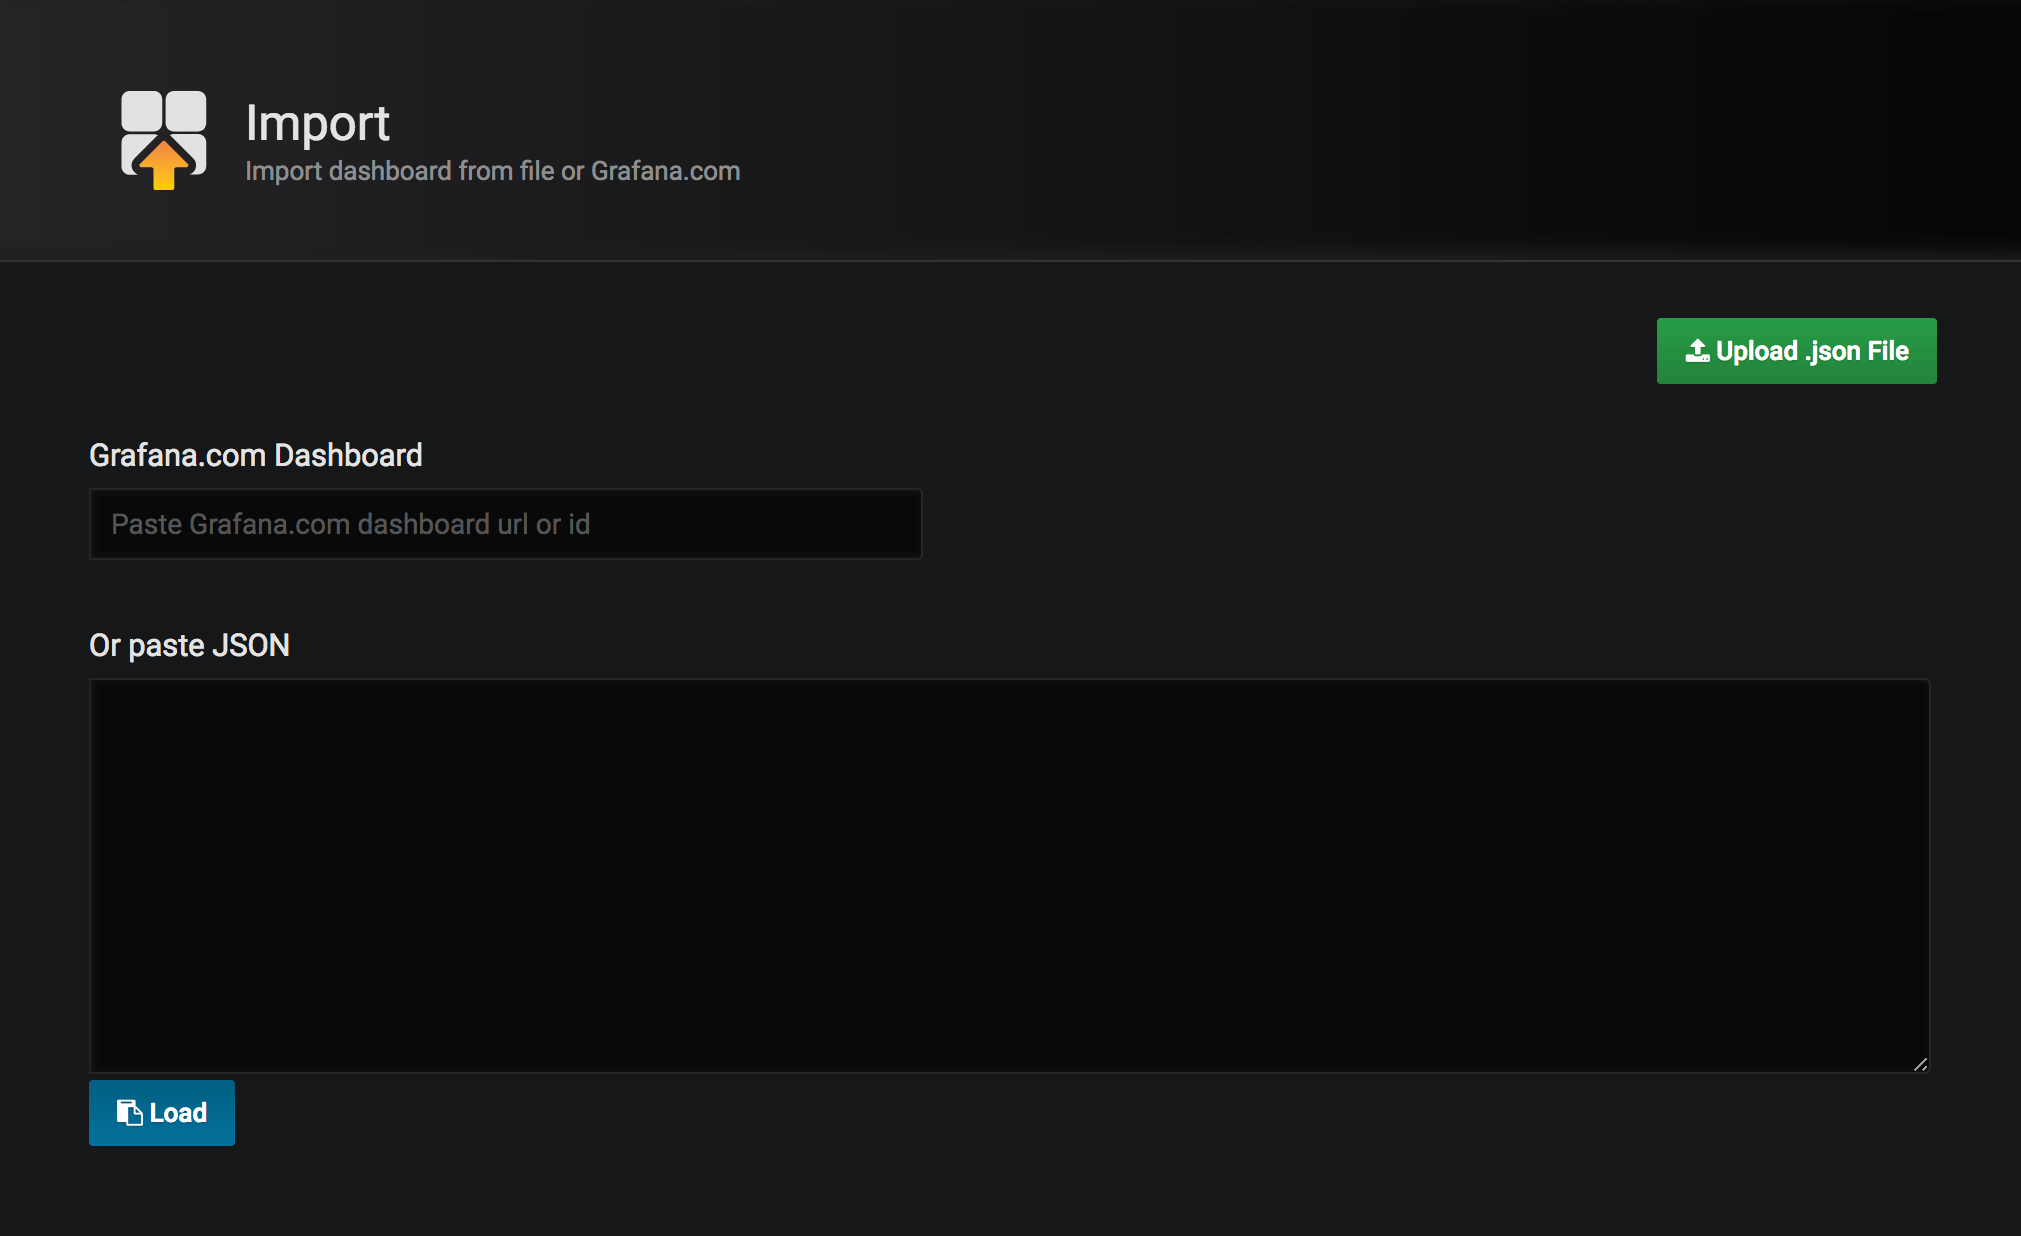
Let’s import a simple dashboard in grafana. We will use already created dashboard for the rails app. Navigate to import screen & paste this board id
10428. Grafana will update configuration and import the board. That’s it. Import is pretty simple and straight forward.
Now we are all prepared to see live performance metrics of our application. After some requests grafana dashboard will look something like
Thanks for reading.
…
References -
- influxdb-rails gem
- influxdb installation
- grafana installation
- grafana import dashboard
- sample-dashboard
 Reset primary key sequence